The Trading-to-Win team is releasing a fantastic visual indicator and a trading concept for Bookmap: TTW-TradeFinder for Bookmap
TTW-TradeFinder Basic, Pro and ULTRA for Bookmap
What is it?
Briefly said, it is a visual presentation of Hidden Orders also known as icebergs, Stop Runs, Sweeps, Liquidity and more.
It is a trading concept based on our daily trading experience.
What we as traders see on our charts is only a fraction of trading activities. Algos, institutional traders and market makers drive the price. Most of these activities are not visible and more than often price action fools us because we don’t see these price manipulations.
Our team started digging deeper into market data to have a better look what’s going on behind the curtain.
We use Market-by-order data to analyze data string for information, like Hidden Orders or icebergs, Stop runs and hidden liquidity changes for every available price level.
Hidden Orders or Icebergs
Did you know that native hidden orders can be in the book for hours, not only for minutes or seconds? Which of them are relevant for trading?
By saying that, we can track or follow them and see at which prices portions of those hidden orders are executed and at which price and time they are finally closed.
TTW-TradeFinder depicts visually directly on Bookmap chart all analyzed Hidden Orders our logic find. You can now select which of them are relevant for you by configuring the volume size based on your instrument’s liquidity. You will experience, that’s of great advantage for you seeing the big Hidden Orders.
And btw. You can close the subchart because every finished Hidden Order is presented dynamically, based on traded volume size, in the lower part of the chart. It becomes impressive to see and follow institutional activities now.

TTW-TradeFinder Hidden Orders – Tracking of Hidden Orders (experimental feature)

TTW-TradeFinder Tracking Hidden Orders
Dynamic Hidden Order Plot
Every finished Hidden Order is drawn as a dynamical plot or signal at the bottom of the chart. Based on traded volume its intensity varies.
The advantage for every trader – given you have defined your chart setup as recommended – is now to see resting limit orders on Bid or Ask AND you can ADD finished hidden orders presented in the lower part of the Bookmap chart Icebergs to the resting orders to get a nearly completely picture of all activities for your instrument!

TTW-TradeFinder Hidden Orders and Resting Orders
Stop Runs
Stop Runs can be considered relevant for trading when you see in a blink what is traded on the Bid and Ask. Not hindsight of course.
Given you understand the power of stop runs, you will be able to see stop runs or sweeps which must be traded against the price.

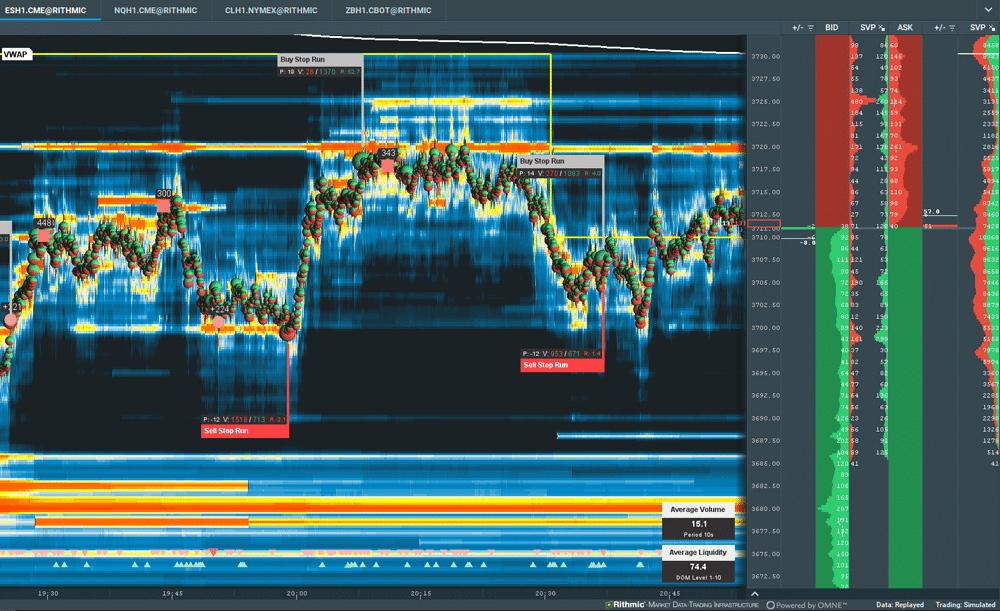
TTW-TradeFinder Stop Runs
Relative and Absolute Liquidity Changes
Additional hidden activities are hidden liquidity changes at price levels close and far away from current price. These secret liquidity changes are done by institutions before price even trades at these levels.
TTW-TradeFinder Pro can detect and reveal this hidden liquidity activities based on your configuration for your traded instrument. You will see, in time, where secret activities take or took place.
These activities will show you immediately, when this changes happen if volume is added or cancelled at a certain price level.

TTW-TradeFinder Liquidity Changes
Average Liquidity and Market Volume Meter
Another issue we as TTW Team have strongly discussed and finally implemented in TTW-TradeFinder, is:
How can we help each trader to determine important liquidity information for an instrument based on facts and not beliefs or assumptions?
We have solved this very practical issue by introducing the Current Average Liquidity Indicator for each instrument.
Why? Because it is crucial to know which liquidity at any given time of a trading day, an instrument is trading.
For example:
The liquidity of the ES March contract future changes constantly. Presession indicates an average liquidity of about 50 contracts per price.
Market starts at 9:30 am EST shows a liquidity of 130-140, later on liquidity raises to 190-200. Liquidity becomes lower after lunch and comes back in the last trading hour.
TTW-TradeFinder gives you the possibility to measure the average liquidity of each instrument.
Based on this objective information, you can define your configuration in TTW-TradeFinder objectively and fact based.
The great message for you here is: No more guessing or assuming!

TTW-TradeFinder Liquidity and Volume Measurement
Alerts
What if we alert you on your mobile or cell phone when your conditions, you defined in TTW-TradeFinder Pro are met?
Yes, we did it! Based on Telegram messenger, you can define which alerts are important for you and which messages you want to receive on your mobile phone based on your TTW-TradeFinder configuration.

TTW-TradeFinder mobile notifications
Subchart
We didn’t want to focus on additional lines and curves in the subchart, although they are there.
You can even close your Bookmap subchart and get all important and relevant signals directly on your chart.
Sit back, relax and watch.
TTW-TradeFinder Subchart
Comparison Table
What about fees? Our approach is to support you becoming a profitable trader. Therefore, we decided to make TTW-TradeFinder reasonable for every trader because our monthly subscription is less than 3 ES (ULTRA edition) eMini points.

More on tradefinder.info | tradefinder.fr